By Bakuei Matsukawa
Table of contents
- Executive summary
- Objective of the article
- Understanding the Cyber Risk Index
- Data collection period, organization count, and size distribution
- Average Risk Indices: Overall, ransomware-infected, and non-infected organizations
- Trends in each index before, during, and after ransomware infection
- Probability of ransomware infection based on Risk Index thresholds
- Deviation score analysis
- Risk ratio analysis using the average Risk Index as a threshold
- Conclusion
- Final thoughts
Executive summary
Ransomware attacks remain a critical threat to organizations worldwide, exploiting vulnerabilities and inadequate security measures. This article emphasizes the importance of reducing the Cyber Risk Index (CRI) through Cyber Risk Exposure Management (CREM) to prevent such incidents. By analyzing data for the first half of 2024 from 6,588 organizations employing CREM, we found a significant correlation between higher Risk Indices and increased susceptibility to ransomware infections. Specifically, organizations that experienced ransomware attacks had an average Risk Index of 52.38, compared to 40.25 for those that did not.
Our key findings indicate that organizations with a Risk Index above the average are approximately 12 times more likely to suffer a ransomware infection than those below, underscoring the necessity for proactive risk management strategies. CREM enables organizations to identify vulnerabilities across their attack surfaces, prioritize risks, and implement effective countermeasures. By focusing on reducing the Risk Index — comprising the Attack Index, Exposure Index, and Security Configuration Index — organizations can enhance their security posture significantly.
The study concludes that lowering the Risk Index below the overall average is crucial for mitigating ransomware risks. Continuous monitoring and management of the Risk Index allows organizations to maintain robust cybersecurity health, preventing potential breaches before they can occur. Implementing CREM not only aids in understanding and visualizing cyber risks but also provides actionable insights for strengthening defenses against ransomware and other cyber threats, thereby ensuring business continuity and reliability.
Objective of the article
This article aims to analyze the CRI of organizations employing CREM that are believed to have fallen victim to ransomware attacks in the first half of 2024. By comparing organizations that experienced ransomware infections with those that did not, we seek to uncover the key differences and explore actionable measures to prevent such incidents. Furthermore, by performing the integrated analysis of threat data, such as ransomware detections, and risk data, such as the Risk Index, we aim to identify environments that are more susceptible to attacks while also providing crucial insights for implementing more effective security strategies. This comprehensive approach allows us to not only understand the factors contributing to ransomware infections, but also to recommend targeted security enhancements that can significantly reduce the risk of future incidents.
Understanding the Cyber Risk Index
The Risk Index is a comprehensive metric that quantifies the overall security risk for an organization. Just as stock market indices aggregate individual stock prices to represent market trends, the Risk Index consolidates individual assets and risk factor scores to assess the organization's overall risk posture. While CREM primarily evaluates risk in a qualitative manner, the Risk Index extends this approach by employing a semi-quantitative method. This method uses a scale from 1 to 100 to provide a more granular representation of risk, allowing organizations to understand where risks are concentrated and providing a clearer picture of their overall risk levels.
Note that in this article, we use the term Risk Index but it carries the same meaning as the CRI. The Risk Index is one of the key indicators provided by CREM, the cybersecurity risk assessment and management feature integrated within Trend’s comprehensive cybersecurity platform, Trend Vision One .
Cyber Risk Exposure Management
CREM is designed to protect an organization's digital assets from attacks by evaluating the risks across its attack surface, prioritizing them, and implementing appropriate countermeasures. This is part of the broader risk management process, which involves identifying, assessing, mitigating, and managing risks. The goal of CREM is not only to visualize risk but to take proactive measures before risks can materialize.
Meanwhile, ASM (Attack Surface Management) is a concept similar to CREM, focusing on identifying and visualizing an organization's attack surface. Since ASM primarily emphasizes risk visualization, it often lacks comprehensive risk evaluation and mitigation strategies, making it more suited for situational awareness. In contrast, CREM goes beyond visualization to conduct thorough risk assessments, set priorities, and implement concrete countermeasures, making it a more effective and holistic approach.
To draw an analogy with healthcare, ASM is akin to a routine health check-up, where the goal is to understand and visualize your physical condition. While the check-up reveals your state of health, it often performs closer examinations into areas that might need more attention, nor does it offer specific insights into how to improve your condition. CREM, on the other hand, provides not only a more comprehensive view of your health, it also analyzes the risks it might be exposed to, and then provides a detailed concrete action plan — such as improving your diet or incorporating exercise. CREM evaluates risks, prioritizes actions, and actively manages health, representing a more advanced approach that goes beyond mere visualization to promote risk mitigation through actionable steps.
CREM operates on the Vision One platform, which in turn enhances CREM by providing real-time visualization, risk management, and automation. With Vision One, CREM enables risk awareness, as well as rapid and precise risk mitigation actions, delivering a more advanced security strategy. By capitalizing on the Risk Index within CREM, organizations can identify vulnerabilities and attack risks across their attack surface, allowing them to optimize their security management.
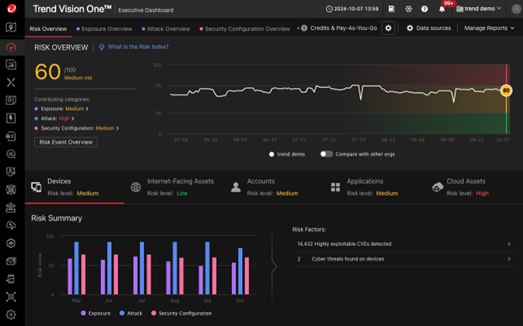 Figure 1. The CREM executive dashboard
Risk Index score and risk levels
The Risk Index is scored on a scale from 0 to 100, where a higher score indicates a greater level of risk. The scores are typically categorized into three risk levels:
- Low Risk (0-30):
- Organizations in this category are considered relatively secure.
- Immediate significant measures are generally not necessary.
- Medium Risk (31-69):
- These organizations have several risk factors that need to be addressed.
- It is advisable to consider and implement appropriate countermeasures.
- High Risk (70-100):
- Organizations falling into this category are exposed to severe risks.
- Prompt and robust security measures are essential to mitigate potential threats.
Components of the Risk Index
The Risk Index is composed of three sub-indices, each providing insights into different aspects of an organization’s security posture:
- Attack Index
- Definition: Reflects the frequency and severity of attacks that an organization faces
- Factors Included: Historical attack data and ongoing attack patterns
- Implications: A higher Attack Index suggests either multiple attack attempts or the presence of ongoing serious threats
- Exposure Index
- Definition: Measures the extent to which an organization’s vulnerabilities and security flaws are exposed externally
- Factors Included: Unpatched vulnerabilities, improper security configurations, and systems accessible via the internet
- Implications: A higher Exposure Index indicates a greater susceptibility to exploitation by attackers
- Security Configuration Index
- Definition: Evaluates whether the security settings within Trend products are properly configured
- Factors Included: Misconfigurations in Trend products, outdated settings, and the adequacy of security configurations
- Implications: High scores indicate misconfigurations or outdated settings within Trend products, increasing the risk of breaches, while lower scores denote robust security settings that mitigate intrusion risks
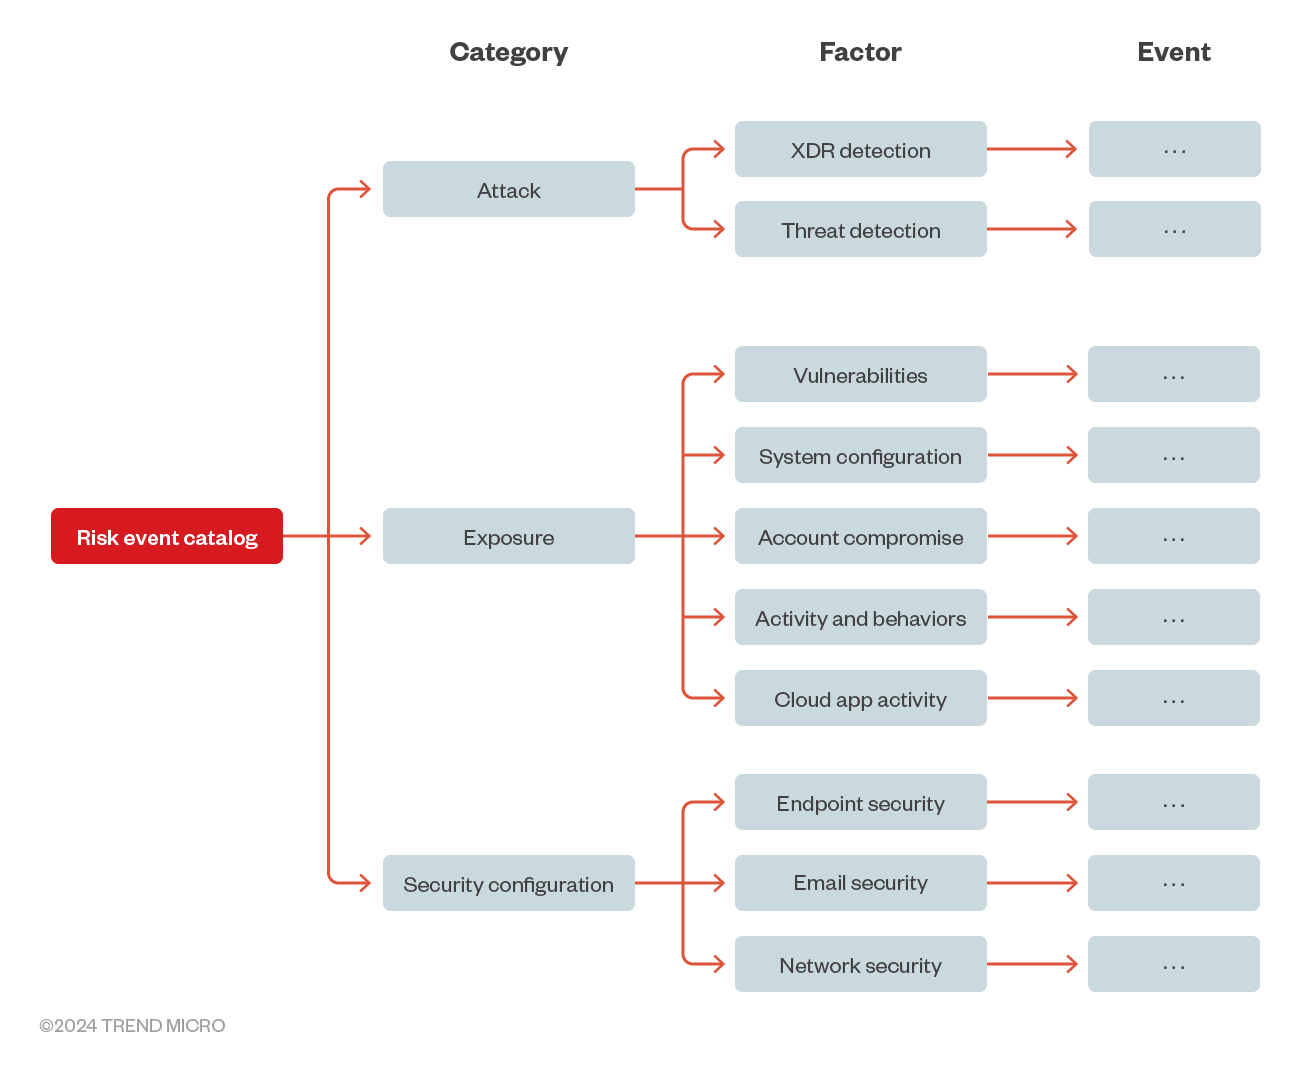 Figure 2. Risk event catalog
For more detailed information about the risk factors that contribute to the Risk Index, refer to this page. An explanation of the calculation methods used for the Risk Index can be found here.
Data collection period, organization count, and size distribution
Our analysis uses data collected from CREM users during the first half of 2024. A total of 6,588 organizations worldwide were included in the dataset, with an average Risk Index of 40.31. The distribution of these organizations by size (number of employees) is as follows:
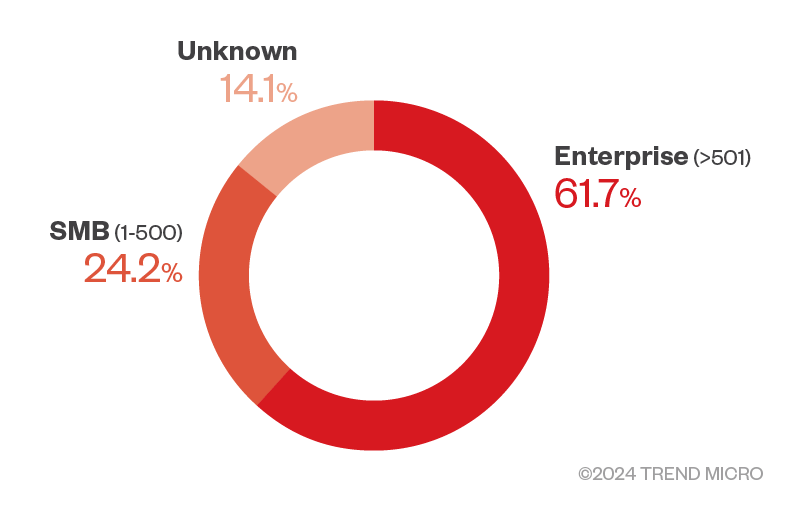 Figure 3. The percentage of CREM users by organization size (number of employees) for the first half of 2024
Average Risk Indices: Overall, ransomware-infected, and non-infected organizations
Based on threat data, 32 organizations within the dataset were identified as highly likely to have suffered ransomware infections. By calculating each organization's Risk Index, we found that these organizations had an average of 52.38. In contrast, when we averaged the Risk Index for organizations that did not experience ransomware infections, the average was 40.25. This difference in average values suggests a correlation between the presence of ransomware infections and the Risk Index.
Criteria for determining ransomware infections
To determine ransomware infections, we used the detection status of ransom notes based on telemetry data from Trend’s Endpoint Protection Platform (EPP) products. A ransom note refers to a message from an attacker that demands payment from the victim in exchange for the decryption of encrypted data or the restoration of access to the system. In Trend products, ransom notes are identified with the detection name format Ransom.[Platform].[Family].[Variant].note.If vulnerabilities exist in the system or if there are misconfigurations in the product settings, attackers may infiltrate and operate within the system, leading to ransomware infection. Once ransomware is deployed and executed, a ransom note is generated during the final stage. Therefore, the detection of a ransom note serves as a critical indicator that the system has been infected with ransomware. Detecting ransom notes enable organizations to promptly initiate incident response measures, contributing to the prevention of the ransomware’s further spread.
Distribution of organizations and comparison of average Risk Indices: infected vs. non-Infected
The distribution and average Risk Index comparison between infected and non-infected organizations are illustrated in the following graphs:
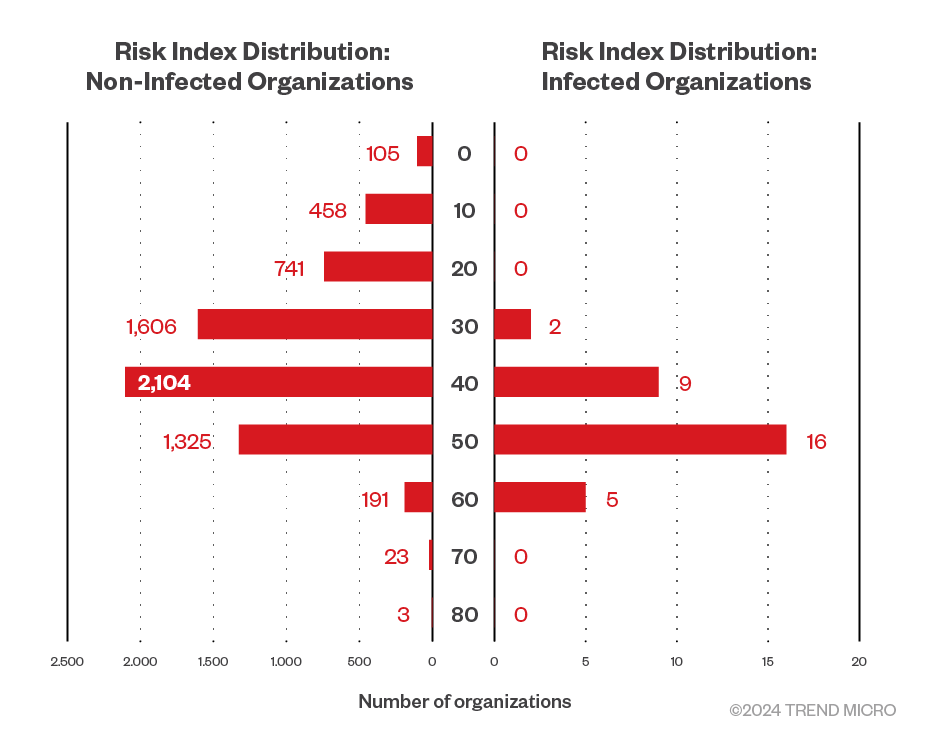 Figure 4. Comparison of Risk Index histograms for ransomware-infected and non-infected organizations for the first half of 2024
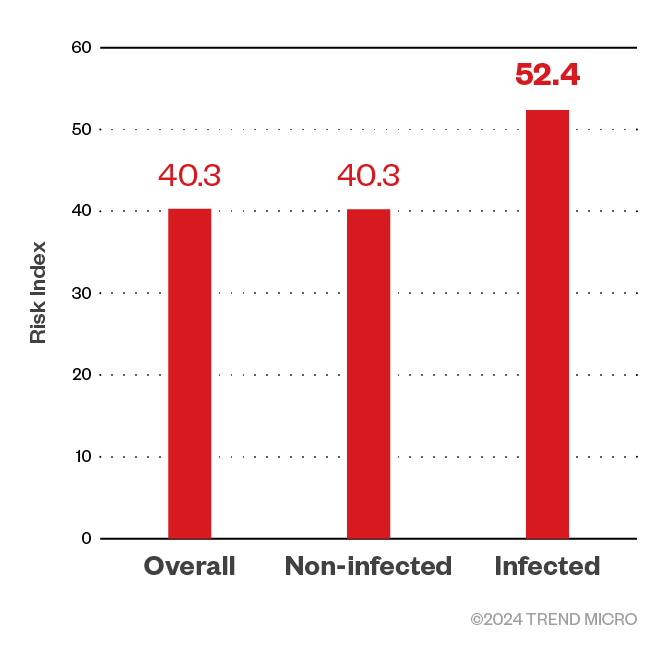
Figure 5. Risk Indices of ransomware-infected (52.38) and non-infected (40.25) organizations for the first half of 2024. The overall risk index for all the organizations (40.31) is also included.
There is a significant difference of 12.13 in the Risk Index between infected and non-infected organizations, representing approximately a 1.3-fold difference. Given the 32 infections out of 6,588 organizations, the probability of a ransomware infection in the first half of 2024 was approximately 0.5%.
Even among security-conscious organizations employing CREM, those operating with a high Risk Index are still susceptible to ransomware infections, albeit at a low percentage. This underscores the importance of not only implementing CREM but also actively managing and reducing the Risk Index to effectively mitigate the risk of ransomware attacks.
A more detailed analysis of the Risk Index trends before and after infection is provided in the following section.
Trends in each index before, during, and after ransomware infection
For organizations that experienced ransomware infections, the average Risk Index was 55.9 in the month preceding the infection, 54.4 during the infection month, and 52.1 in the month following the infection. This trend indicates a gradual decrease over time, likely due to enhanced risk management measures implemented after the attack was detected. However, this modest reduction suggests that significantly strengthening risk management in the wake of a major ransomware incident is not an immediate (or easy) task for organizations.
Detailed analysis of sub-indices for infected organizations
To analyze the infection situations in more detail, let's look at the average values for the ransomware-infected organizations in the three sub-indices that make up the Risk Index: the Exposure Index, the Attack Index, and the Security Configuration Index.
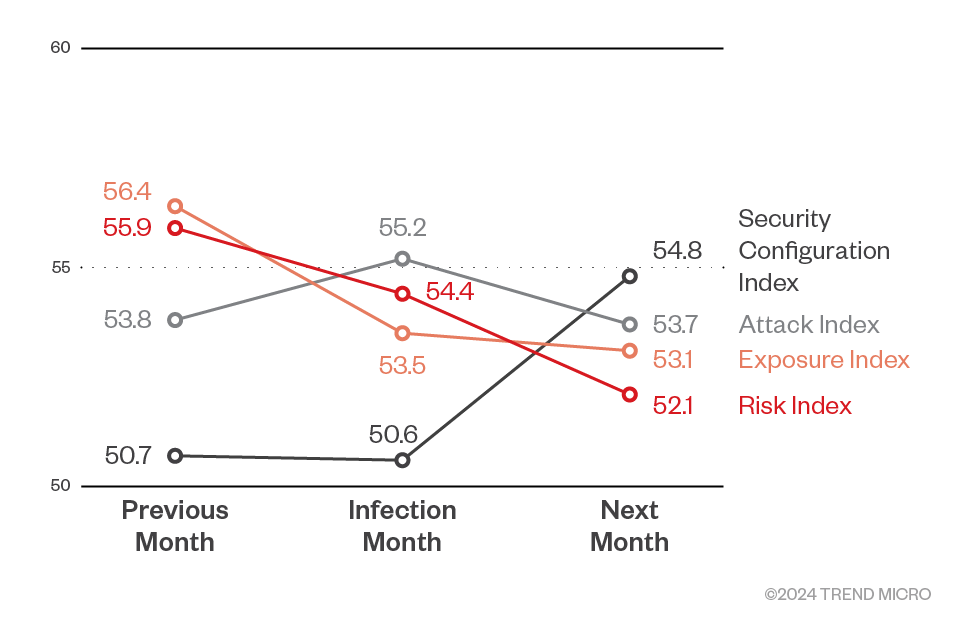 Figure 6. Risk indices in the month before, during, and after ransomware infection during the first half of 2024
- Exposure Index
- Before Infection: 56.4
- During Infection: 53.5
- After Infection: 53.1
- Analysis: The notably high Exposure Index before infection may indicate a highly vulnerable state, which contributed to the ransomware breach. The subsequent decline could suggest the implementation of emergency measures such as disabling VPNs or remote desktop protocol (RDP) devices, applying patches, resetting accounts, and altering configurations, to prevent further infections.
However, the slight decrease in the Exposure Index post-infection may reflect the challenges in swiftly and thoroughly enhancing security configurations. Since responding to ransomware infection incidents can take several months, the month following the infection might still be part of the incident response process, and it is possible that comprehensive recurrence prevention measures have not yet been fully implemented.
- Attack Index
- Before Infection: 53.8
- During Infection: 55.2
- After Infection: 53.7
- Analysis: The increase to 55.2 during the infection month, from 53.8 the previous month, is attributed to the multitude of attacks leading up to the successful ransomware breach. The limited increase suggests that attackers were able to infiltrate the target system quickly without necessitating additional attack attempts. Post-infection, the Attack Index slightly decreases to 53.7, indicating a stabilization after the breach.
- Security Configuration Index
- Before Infection: 50.7
- During Infection: 50.6
- After Infection: 54.8
- Analysis: Interestingly, this index rose from 50.6 before infection to 54.8 after. This could potentially result from an overemphasis on immediate recovery efforts, which may sideline comprehensive security configuration reviews and management. For example, organizations might prioritize system restoration over adhering to security best practices, potentially leading to temporary compromises in security settings.
Probability of ransomware infection based on Risk Index thresholds
To examine how changes in the Risk Index affect the probability of ransomware infections, we employed a detailed analysis method consisting of the following steps:
Calculation steps
- Setting Risk Index thresholds
- The Risk Index was set at thresholds ranging from 1 to 100 in one-point increments.
- Classification of organizations based on thresholds
- Organizations below the threshold: The number of organizations with a Risk Index below each threshold and the number of infections within this group
- Organizations above the threshold: The number of organizations with a Risk Index at or above each threshold and the number of infections within this group
- Calculation of infection probability
- For each group, the number of infected organizations was divided by the total number of organizations in that group to determine the probability of infection
Sample calculation
- Threshold at Risk Index 40:
- Organizations below 40
- Total Organizations: 2,912
- Infected Organizations: 2
- Infection Probability: (2 ÷ 2,912) × 100% ≈ 0.069%
- Organizations above 40
- Total Organizations: 3,676
- Infected Organizations: 30
- Infection Probability: (30 ÷ 3,676) × 100% ≈ 0.82%
- Organizations below 40
The results of the calculations using this analytical method are shown in the following graph.
 Figure 7. Ransomware infection probability below and above Risk Index thresholds (first half of 2024)
The analysis revealed a sharp increase in the probability of ransomware infections for organizations that have Risk Index hovering around 40. Additionally, the apparent decrease in infection probability near a Risk Index of 60 is likely due to the small sample size, rather than an actual reduction in risk. As shown in the histogram presented in Figure 4, the number of infected organizations with a Risk Index exceeding 60 is extremely small — therefore, the infection probability when using this as a threshold also appears to decrease. This can be interpreted as a result of statistical fluctuations due to the very small number of infected organizations with a Risk Index of 60 or higher in the dataset used for this analysis. In regions with small sample sizes, estimated values can become unstable.
Deviation score analysis
Given that a Risk Index of 40 is close to the overall average (40.31), we transformed the Risk Index into a deviation score (with 50 as the mean) to statistically assess deviations from the average. To clarify the key points, the graph displays infection probability as a percentage on the vertical axis and limits the horizontal axis to a deviation score of 58, excluding ranges that are not statistically reliable.
What is a deviation score?
A deviation score, also known as a standard score or z-score in statistical terms, measures how far a data point is from the mean of a dataset. In this system, a mean of 50 is typically used (though other means like 0 are common in other countries), with scores above 50 indicating a value above average, and scores below 50 indicating a value below average. This transformation allows for an intuitive understanding of how much an organization's Risk Index deviates from the overall average, thereby clarifying the relationship between Risk Index deviations and infection probabilities.
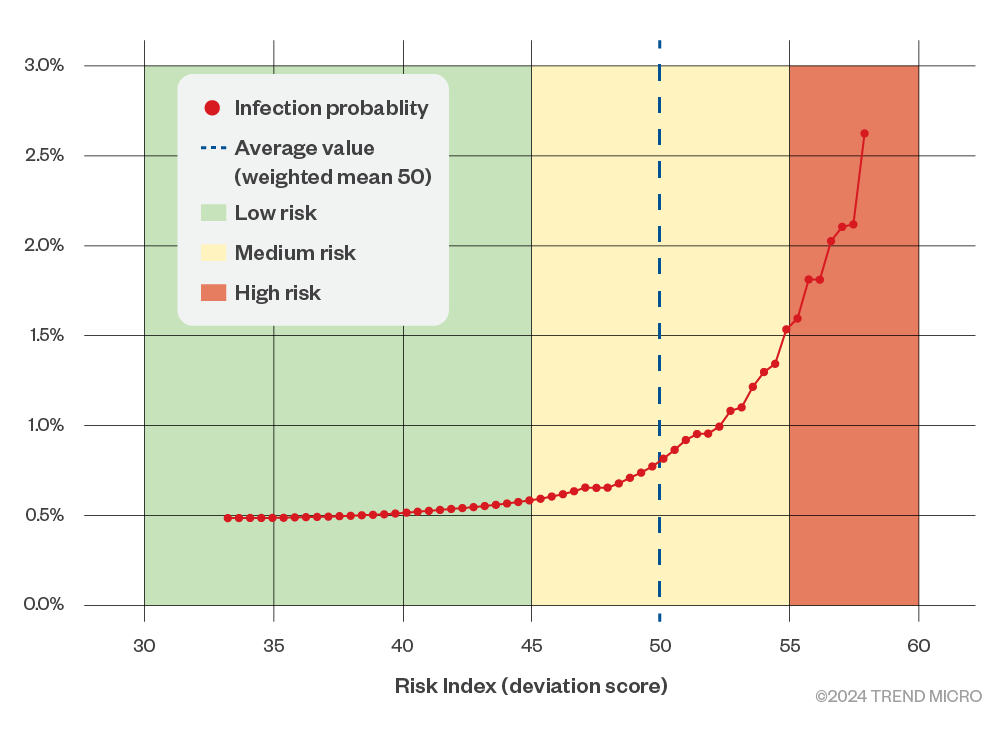 Figure 8. Ransomware infection probabilities above threshold using Risk Index deviation scores (first half of 2024)
The graph clearly demonstrates a sharp increase in the probability of infection around the overall average Risk Index. Based on these findings, it is advisable to interpret Risk Index deviation scores for ransomware infections as follows:
- Deviation score below 45: Low Risk
- Deviation score between 45 and 55: Medium Risk
- Deviation score above 55: High Risk
Assuming that ransomware attacks are carried out indiscriminately against organizations where intrusion attempts have succeeded, this approach is valid. Since attackers operate with limited resources and time, they tend to target organizations that are relatively easier to infiltrate, resulting in only those organizations being affected. Considering this situation, it can be concluded that organizations can more accurately assess their ransomware infection risk by comparing their own Risk Index to the overall average.
Risk ratio analysis using the average Risk Index as a threshold
To assess how much the probability of ransomware infection differs between organizations with a Risk Index above and below the overall average, let's use the overall average value of 40.31 as a threshold and compare their respective infection risks.
Calculation of risk ratio
- Classification of organizations
- Organizations above the average Risk Index (≥ 40.31)
- Total organizations: 3,610
- Infected organizations: 30
- Infection probability: (30 ÷ 3,610) × 100% ≈ 0.83%
- Organizations below the average Risk Index (< 40.31)
- Total organizations: 2,978
- Infected organizations: 2
- Infection probability: (2 ÷ 2,978) × 100% ≈ 0.067%
- Organizations above the average Risk Index (≥ 40.31)
- Risk ratio calculation:
- Risk ratio (relative risk): 0.83% ÷ 0.067% ≈ 12.37
- Interpretation: Organizations with a Risk Index above the average are approximately 12 times more likely to suffer a ransomware infection compared to those below the average
Statistical significance testing
To determine whether the observed difference in infection rates between the two groups is statistically significant, we performed Fisher's Exact Test on a 2x2 contingency table.
| Infected | Non-infected | Total | |
| Risk index >= average | 30 | 3,580 | 3,610 |
| Risk index < average | 2 | 2,976 | 2,978 |
| Total | 32 | 6,556 | 6,588 |
Table 1. Ransomware-infected and non-infected organizations and their Risk Index value compared to the average value
The test resulted in a p-value of < 0.001, indicating that the difference in infection rates between the two groups is statistically significant and unlikely to have occurred by chance. In this data, there is a significant class imbalance with a disproportionately large number of non-infected cases. Therefore, as a precaution, we also conducted a test using a dataset where the number of non-infected cases was downsampled to one-hundredth. The p-value in this test was also below 0.001, indicating that the class imbalance does not affect the test results.
Implications of the risk ratio
The risk ratio is an indicator that shows how much higher the risk is under certain conditions compared to other conditions. For example, according to information published by the U.S. Centers for Disease Control and Prevention (CDC), smokers are 15 to 30 times at higher risk of developing lung cancer compared to non-smokers. This means that the act of smoking significantly increases the risk of developing lung cancer.
Similarly, in this risk ratio analysis, it was found that organizations with a Risk Index above the average are approximately 12 times more likely to suffer a ransomware infection compared to organizations below the average Risk Index. This risk ratio indicates how much more susceptible organizations with a higher Risk Index are to ransomware infections compared to those with a lower Risk Index. In other words, environments with a high Risk Index become prime targets for ransomware attackers.
Conclusion
Our analysis demonstrates that organizations affected by ransomware attacks have, on average, a Risk Index approximately 1.3 times higher (52.38 vs. 40.25) than those that were not. The steep rise in infection probability near the average Risk Index and the tendency for high Exposure Indices among infected organizations suggest that attackers indiscriminately target organizations with insufficient security measures. For example, attackers scan a large number of IP addresses on the internet, and when finding systems with vulnerable services on open ports, they automatically launch attacks.
Malicious actors are not targeting specific organizations; rather, any system that can be infiltrated becomes a target. Therefore, organizations with unpatched VPN devices or poorly secured RDP endpoints are more likely to fall victim to attacks. The risk ratio analysis further confirms that organizations with above-average Risk Indices are approximately 12 times more likely to be infected compared to those with lower Risk Indices. These findings underscore the usefulness of the Risk Index as a vital metric for evaluating an organization’s cybersecurity posture.
Based on the data from the first half of 2024 that we analyzed, we can conclude that reducing the Risk Index below the overall average is crucial for mitigating the risk of ransomware attacks. In the future, this threshold may change if the average Risk Index decreases due to factors such as CREM users actively implementing measures to lower their scores or ransomware attackers altering their methods of target selection. Nevertheless, the approach of comparing organizational Risk Indices to the overall average and evaluating risk relative to it remains valuable.
For organizations already utilizing CREM and aiming to prevent ransomware infections, taking advantage of the platform’s ability to compare Risk Indices against regional, size-based, and industry-specific averages is recommended. Organizations should strive to maintain their Risk Index below the average to enhance their security posture. Conversely, organizations not yet using CREM are encouraged to try it to visualize their cyber risks and start on the road to implementing proactive risk management.
Caveat: With only 32 ransomware-infected organizations out of 6,588 included in the dataset, statistical biases and random variations cannot be entirely ruled out. Therefore, the results should be interpreted as indicative trends rather than definitive figures. Nevertheless, even with limited data, there is strong evidence suggesting a correlation between higher Risk Indices and increased ransomware infection risks. Future analyses with more extensive data will help clarify the relationship between the Risk Index and ransomware susceptibility.
Final thoughts
CREM is a powerful solution that transforms an organization's qualitatively assessed cybersecurity risks into semi-quantitative metrics, visualizing them in a manner that provides a more precise understanding of overall risk levels. The Risk Index functions as a cybersecurity barometer, similar to how regular health check-ups monitor vital signs like blood pressure, cholesterol, and blood sugar to manage overall health. When these health metrics exceed standard thresholds, the risk of future illnesses increases, prompting many individuals to reassess their lifestyles. For instance, by improving diets or adopting exercise routines, individuals can enhance their health through small, incremental efforts, thereby reducing their health risks.
Similarly, organizations can leverage CREM to continuously monitor their Risk Index. By implementing specific measures such as patching vulnerabilities and strengthening security configurations, organizations can defend against ransomware and other cyberthreats, thereby enhancing business continuity and reliability. Regularly checking the Risk Index and responding swiftly to any detected anomalies allows organizations to maintain their cybersecurity "health." This proactive approach ensures that significant negative impact is prevented before it occurs, much like maintaining good health and regular check ups prevents serious illnesses.
Like it? Add this infographic to your site:
1. Click on the box below. 2. Press Ctrl+A to select all. 3. Press Ctrl+C to copy. 4. Paste the code into your page (Ctrl+V).
Image will appear the same size as you see above.
 Cellular IoT Vulnerabilities: Another Door to Cellular Networks
 AI in the Crosshairs: Understanding and Detecting Attacks on AWS AI Services with Trend Vision One™
 Trend 2025 Cyber Risk Report
 CES 2025: A Comprehensive Look at AI Digital Assistants and Their Security Risks