Intercepting Impact: 2024 Trend Micro Cyber Risk Report
img test
Differentiating threat data and risk data
THREAT
DATA
- Typically measures the prevalence and criticality of threats to users
- Analyzes threats themselves
- Attacks or attack attempts have already happened
RISK
DATA
- Factors that contribute to the likelihood and impact of an attack
- Considers threat detection, system configuration, malicious activity, account and network security, and more
- Provides an insight on the likelihood of attacks or attack attempts
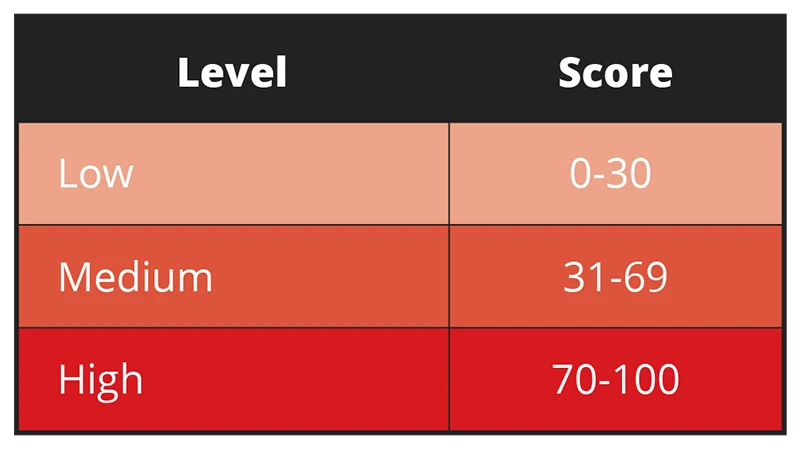
Calculating risk scores
Trend Vision One uses the risk event catalog to formulate a risk score for each asset type and an index for organizations by multiplying an asset’s attack, exposure, and security configuration by the impact. The risk scores are calculated individually for every asset, with each score considering asset type and criticality. The result is an integer between zero and 100 that falls into one of three levels. Learn more with our Risk Index Overview and our technical report on how to understand risk score calculations.
Enterprise expansion full speed ahead, challenging the traditional approaches to security as SOCs catch up
Average risk index by region, company size, and industry
Overall figures show that enterprises average at medium-risk scores. This is a good indicator of good risk management practice: while companies could still get a high-risk score, they rarely persistently do so or stay within that level, indicating that they continuously monitor their risk score and mitigate as necessary to keep their index low or at least at an acceptable level.
The Americas ranked the highest among regions with an average risk index of 44.6, within the medium risk level. The past year was characterized by vulnerabilities in the region’s banking sector. Its critical infrastructure is also being targeted by Volt Typhoon, a hacker group that deploys malicious software that exploits vulnerabilities such as weak administrator passwords, factory-default logins, and devices that have not been updated.
Meanwhile, the Latin Americas since 2023 experienced an onslaught of online scams.

Figure 1. Average risk index by region (1H 2024)
Average risk index by region, company size, and industry
Large enterprises have the highest risk level among company sizes at 48.4, within the medium risk level. This could be attributed to the naturally wider attack surface of companies with more assets to equip over 10,000 employees, making it more difficult to patch and fix misconfigurations. Logically, fewer employees should make it easier for an enterprise to manage its risk levels, but other factors can still hinder this: non-application of best practices, poor cybersecurity hygiene, and lack of user education, among others. But as companies expand, so will the need for systems that simplify and unify security coverage without increasing bandwidth on SOCs and operations.

Figure 2. Average risk index by company size (1H 2024)
Average risk index by region, company size, and industry
The aerospace sector has the highest average risk index rating of 59.5, closely followed by the defense industry at 59.4, both within the medium-risk level. Organizations within these industries face a heightened risk of attacks as geopolitical tensions fuel cybercriminal motivations. The aerospace industry as critical infrastructure makes it more attractive and more vulnerable to cyberthreats; sensors on almost every part of aircraft exponentially increase potential attack vectors.
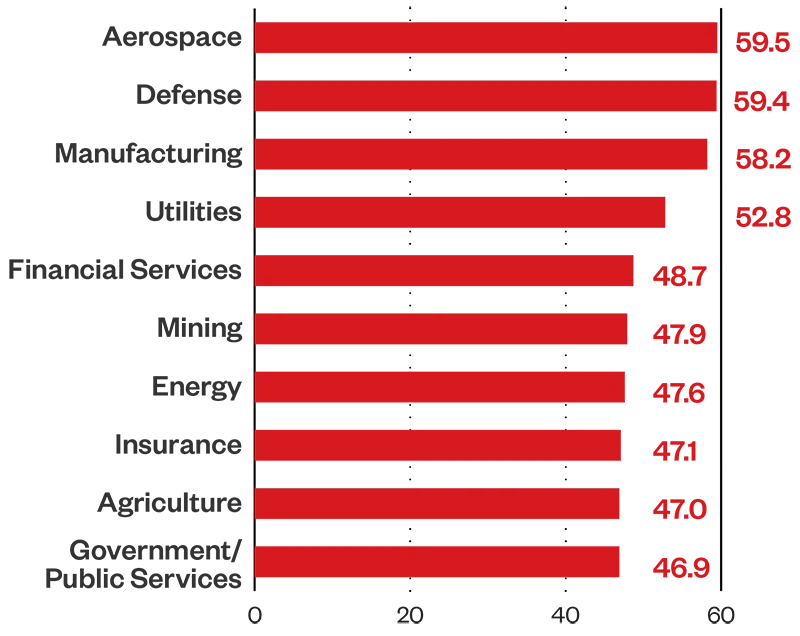
Figure 3. Average risk index by industry (1H 2024)
Secure endpoints with zero-trust approach, educate users on security control compliance and against accessing risky cloud applications
Total high risk asset count by asset type
Our telemetry shows that 3.9% of devices register a high-risk score, emphasizing the need for endpoint security, particularly on security configurations and user education to ensure that risk in minimized on every device under enterprises.
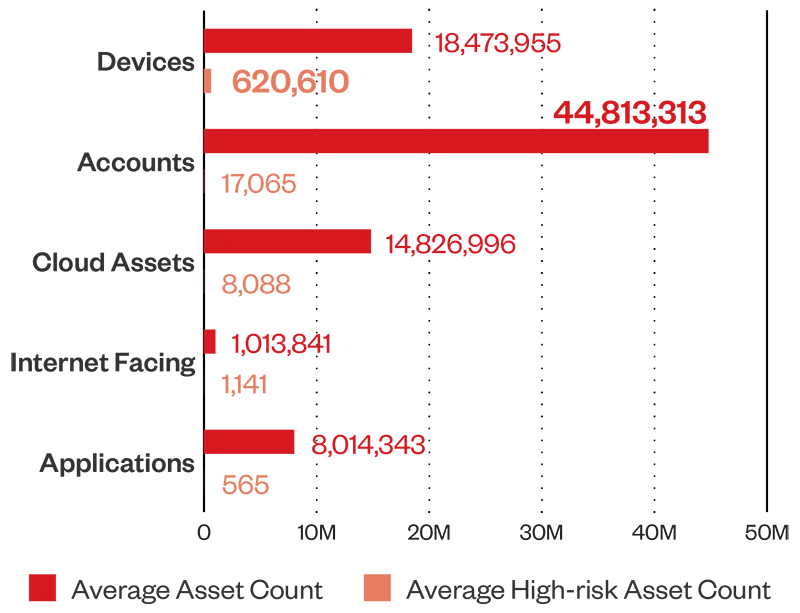
Figure 4. Total high risk asset count by asset type (1H 2024)
Top 10 events
In the first half of 2024, users accessed cloud applications with a high-risk level based on historical application data, known security features, and community knowledge at an average of 821 million times. Old and inactive accounts, accounts with disabled security controls, and sensitive data being sent outside the network are other risk events with high event counts. We recommend prioritizing user education, especially as enterprises rely more on cloud services.
| Event name | Event count |
|---|---|
| Risky Cloud App Access (Detected: Access to a cloud app with high-risk level) | 821,148,651 |
| Stale Microsoft Entra ID Account (Detected: An on-premises Entra ID account with roles inactive for more than 180 days) | 131,606,979 |
| Virtual Analyzer - Email Risk (Detected: A high-risk event to an email account and took the configured action) | 82,159,848 |
| Data Loss Prevention - Email Violation (Detected: An account sent sensitive data and took the configured action) | 30,250,685 |
| On-Premises AD Account with Weak Sign-in Security Policy (Detected: Password Expiration Disabled) | 27,016,177 |
| Microsoft Entra ID Account with Weak Sign-In Security Policy - Password Expiration Disabled (Detected: Password expiration disabled) | 23,676,849 |
| Advanced Spam Protection - Policy Violation (Detected: An account violated a policy and took the configured action) | 21,835,469 |
| Stale On-Premises AD Account (Detected: An on-premises AD account with roles has been inactive for more than 180 days) | 18,649,882 |
| Microsoft Entra ID Account with Weak Sign-In Security Policy (Detected: Strong Password Disabled) | 17,773,668 |
| On-Premises AD Account with Weak Sign-In Security Policy (Detected: Password Not Required) | 15,778,244 |
Figure 5. Top 10 risky events from (1H 2024)
Accounts
While devices make up the most high-risk assets, a closer look at our asset analysis on accounts reveals that internal account assets have the highest average asset count with a high-risk score level, and the highest average asset count with a medium-risk score level. Guest accounts follow in terms of highest average asset count with a medium-risk score level. Security teams should check and monitor these types of accounts and look out for misconfigurations and vulnerabilities that could be leveraged by cybercriminals to gain a foothold on an enterprise’s network.
More information:
Trend Micro's Vision One categorizes user accounts into three: guest accounts, local accounts, and internal accounts:
- Internal Account: These are accounts that belong to the enterprise domain and are managed centrally within the organization’s infrastructure. They are used by employees and are operated on enterprise-owned devices.
- Local Account: These accounts are not managed by the enterprise domain but are operated on devices owned by the enterprise. Examples include:
- Testing and Development: Developers or IT staff create local accounts on new servers or computers to test configurations or software in an isolated environment.
- Kiosk or Public Access Computers: Machines in public areas, like lobbies or kiosks, use local accounts to provide limited access to specific applications without domain login.
- Temporary Access: Contractors or technicians may use local accounts on devices they need for short-term tasks without accessing the full corporate network.
- Legacy Systems: Older systems that are not integrated into the corporate domain use local accounts for access and administration.
- Offline Scenarios: Devices in environments with limited or no network connectivity use local accounts since they can't communicate with domain controllers.
- Guest Account: These are accounts belonging to external users given limited access to the company’s resources. Defined as guests in Azure, they are typically used by partners, vendors, or temporary collaborators.
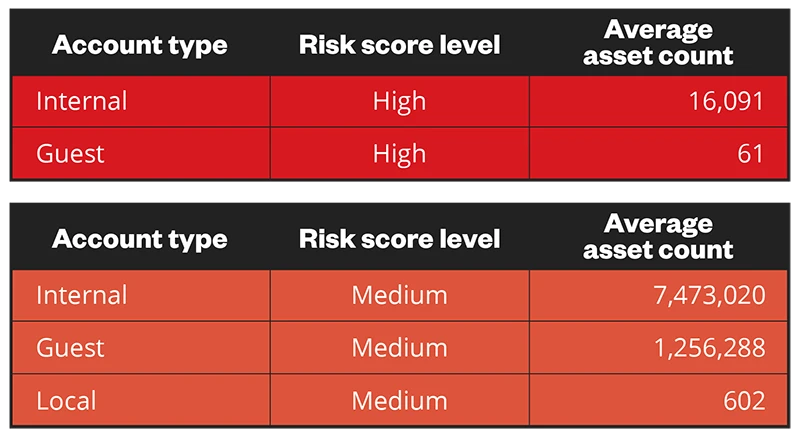
Figure 6. Asset count by account type risk level (1H 2024)
Average managed and unmanaged devices count
As shown in Figure 4, devices have the highest average high-risk asset count at 620,610. Our telemetry reveals that of the total device count, there are more unmanaged devices.
Unmanaged devices are discovered by security solutions as not under Trend Micro control or oversight within an organization’s IT or security management systems; they pose greater risk to enterprises, as they are likely to lack updated endpoint protection. Managed devices, on the other hand, are detected as having installed and enabled Trend Micro endpoint security solutions, actively monitored and maintained by an organization’s cybersecurity team.

Figure 7. Average Managed and Unmanaged Devices Count (1H 2024)
Maximize tools available, such as enabling advanced detection capabilities and behavior monitoring to identify risk ahead of attacks
Average mean time to patch (MTTP) by region, company size, and industry
Europe is the quickest region to patch vulnerabilities with an MTTP for the first half of 2024 averaging just over 26 days. Meanwhile, the Asia Pacific, Middle East, and Africa region patches vulnerabilities at over 28 days. The Americas has an average MTTP of just over a month, a good turnaround time – but could be better; its MTTP is above the overall average, and this region has the highest average risk index among the regions.

Figure 8. Average MTTP by region (1H 2024)
Average mean time to patch (MTTP) by region, company size, and industry
Small businesses take the shortest amount of time on average to patch vulnerabilities, which could be attributed to a smaller attack surface that is easier to manage. Interestingly, enterprises with 2,000 to 5,000 employees struggle with patching, taking an average of 39 days to patch, which could be attributed to deprioritizing security as business expands. Large enterprises take the longest average time to patch; their SOCs naturally grapple with a larger attack surface and could also be bogged down by legacy internal applications that slow down patch roll out.
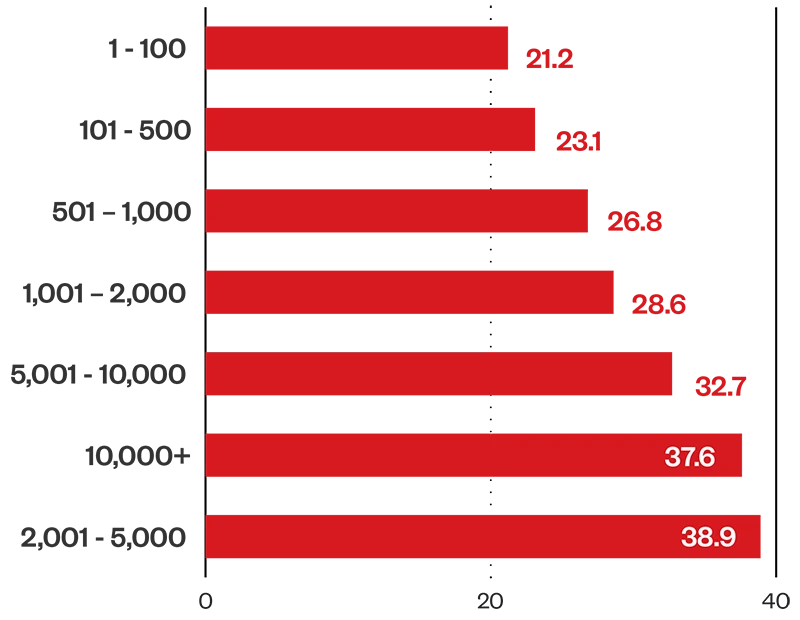
Figure 9. Average MTTP by company size (1H 2024)
Average mean time to patch (MTTP) by region, company size, and industry
The defense industry takes the shortest average time to patch vulnerabilities at just over a week; an ideal MTTP, as the sector is a hot target due to its critical role in respective national securities, apart from the sector registering an average risk index rating of 59.4. Public safety, security and peace could be affected by how well the defense sector equips itself against cyberattacks. The aerospace sector takes twice as long as the defense industry to patch vulnerabilities; we recommend allotting resources to improve this.
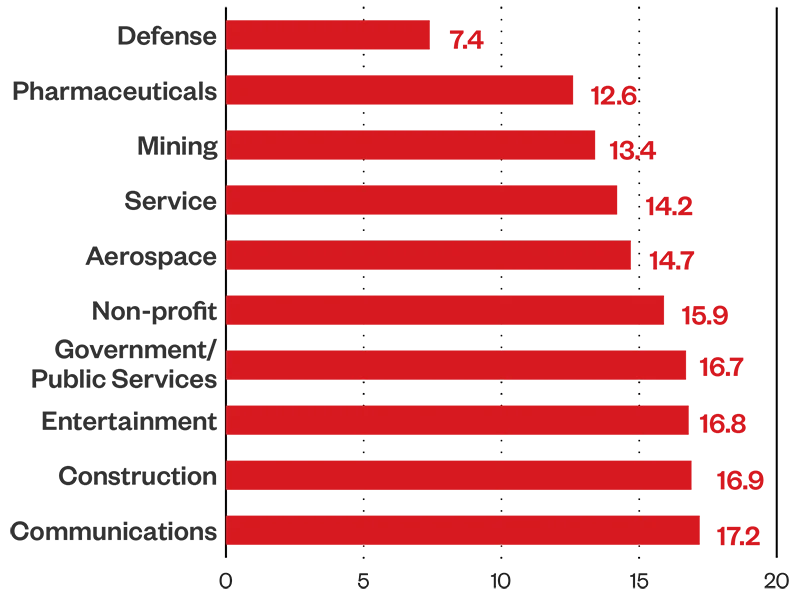
Figure 10. Average MTTP by industry (1H 2024)
MITRE attack analysis
Cybercriminals continue to find ways to abuse legitimate tools to avoid detection, with Metasploit Meterpreter and DNS tunneling among the top detected MITRE sub-categories in our telemetry. Attackers are also working smarter by targeting the very services that should detect them, such as leveraging PowerShell scripts to interact with Local Security Authority Subsystem Service (LSASS).
Top detected MITRE sub-categories
01
Detection for Metasploit Meterpreter
02
LSASS Access via Suspicious Powershell Parameters
03
High Volume Multiple SSH Connections
04
DNS Tunneling
05
Remote Code Execution via HTTP
06
Powershell AMSI Scan Bypass
07
Possible Renamed TCPDump Execution
08
Screen Capture and Keylogging via Powershell
09
Suspicious Command and Control Connection
10
Behavior Monitoring Detection for Built-in Windows Tools
Exploitable vulnerabilities
Looking at the prevalent CVEs detected and the high exploit vulnerabilities across region and company size, organizations can see specifically see what the attackers are targeting and where they are at risk. A CVE’s risk event risk score is calculated based on the following formula:

In this formula, likelihood is the assessment result that considers CVE static attributes, exploit status, report status, threat intelligence, and mitigation measures (such as patch status, IPS enablement, among others). Criticality on the other hand, is the projected business impact of the affected asset.
We recommend identifying if you or your enterprise might be affected by the following vulnerabilities, and to patch as soon as possible.
A risk-based approach to cybersecurity will shift an enterprise’s strategy from being reactive to proactive. By recalibrating to be more proactive, an enterprise can make their time and resource allocation more efficient even as it expands and demands more security coverage.
Adopt a risk-based approach to anticipate threats, strategize resource allocation, tailor security measures, and enhance situational awareness with the continuous discovery, assessment and mitigation of an enterprise’s IT ecosystem. By identifying high, medium, and low risk components of the attack surface, organizations can create an action plan to prevent attacks before they even happen and lower their overall risk in the near, medium, and long term.
Based on our telemetry from for the first half of 2024, we recommend the following best practices to begin improving your enterprise’s risk score.
01
Optimize security settings to maximize product features and be alerted on misconfigurations.
02
When a risky event is detected, contact the device and/or account owner to verify the event, and investigate the event using the Vision One Workbench. Utilize the Vision One Workbench search function to find more information about the event or check the event details on product management server.
03
Disable risky accounts or reset them with a strong password and enable multi-factor authentication (MFA).
04
Apply the latest patches or upgrade the version of applications regularly.
05
Apply the latest patches or upgrade the operating system version regularly.
Like it? Add this infographic to your site:
1. Click on the box below. 2. Press Ctrl+A to select all. 3. Press Ctrl+C to copy. 4. Paste the code into your page (Ctrl+V).
Image will appear the same size as you see above.
Recent Posts
- Hunt Them All: An AI-Powered Vulnerability Sweep of 19,000 MCP Servers
- Pwning Agentic AI Part I: Your AI Agent Is Already Compromised
- TrendAI™ and CleanDNS: From Blocking Attacker Infrastructure to Removing It From the Internet
- A Hidden Vulnerability in Healthcare: Exposed DICOM Servers and the Risk to Patient Data
- Update on Exposed MCP Servers: The Threat Widens to the Cloud
 Fault Lines in the AI Ecosystem: TrendAI™ State of AI Security Report
 It’s By Design: The Use-After-Free of Azure Cloud
 Ransomware Spotlight: Agenda
 Guarding LLMs With a Layered Prompt Injection Representation